In a previous post, I discussed some concerns about the findings reported in (Krishna Kumar et al. 2015) of bias in GREML-based heritability estimates. Contra their conclusion, simulations where model assumptions were met yielded unbiased estimates of heritability and it’s approximated standard error. The discrepancy observed in SKK appears to be due to their comparison of approximated standard errors from a large sample to standard deviations from a small sample. SKK also analyzed a real phenotype (systolic blood pressure, SBP) from the Framingham Heart Study data and drew conclusions about GREML for real data. These results include additional complexities due to linkage disequilibrium (LD) and “genetic stratification”. While both are model violations, they are ubiquitous confounders in human studies and the authors are well-motivated to evaluate their impact. However, I believe the various forms of confounding attributed to genetic stratification by SKK are either expected behavior in the presence of LD, or due to incomplete removal of related individuals. Confounding due to stratification is a subtle concept and I’ll start with some simple simulations demonstrating it’s expected effect on GREML and then justify my interpretation of the SKK findings.
Stratification can bias GREML estimates. The GREML model assumes that an individual’s genetic value (the total contribution of genetics to phenotype) is drawn randomly from the population and the covariance across individuals is modeled by the genetic relatedness matrix (GRM) with random environmental noise. When individuals are related, both assumptions are violated. To demonstrate this, I again started with the simulation framework used in SKK and the previous post: SNPs are randomly generated, assigned random effect-sizes, and used to generate an additive phenotype with heritability = 0.75; then, a GRM is constructed from the SNPs and heritability is estimated using GREML. To model independent, untyped variants, I modified the framework so that only half of the SNPs are included in the GRM, which means an unbiased SNP-heritability estimate should be 0.75/2=0.375. The generative model is , where and are the genotyped and untyped SNPs; and the inferential model is
Then, extreme relatedness is introduced by replacing one individual at a time with their twin (i.e. duplicating their genetics) and rerunning the generative model + estimation. [Note: the GRM can include twins/duplicates and be singular because REML inverts the non-singular matrix ]. Importantly, there is no population stratification, all SNPs are completely independent, and there is no explicit shared environment between the twins (the environmental term for them is still random). These are interesting additional confounders, but this simulation is meant to demonstrate bias in the most simple case. The estimate of heritability from 500 simulations and increasing levels of relatedness is plotted below:

For each relatedness level, the density of heritability estimates is shown with a gray violin plot; the mean and standard deviation is indicated by the solid black point and error bar; and the standard error approximated by GREML is indicated by the small unfilled circles. First, when there is no relatedness (x=0) the estimate of SNP-heritability is unbiased around 0.375 and the approximated standard error matches the observed standard deviation. Second, as relatedness is introduced the estimate becomes upwardly biased and quickly approaches the true underlying heritability. Third, as relatedness is introduced the empirical standard deviation decreases (the violin spread decreases). And finally, the approximate standard error (unfilled circles) becomes slightly biased and underestimates the true variance. Notably, these biases are substantial even with a very small fraction of twins in the data (20-50 out of 1,000 total individuals); with less extreme relatedness the same biases could be achieved with hundreds of samples.
To confirm that this effect is due to the untyped SNPs and not a hidden confounder, I simulated a phenotype with no untyped SNPs (and SNP-heritability = heritability = 0.5). Here, no bias in the estimate or the standard error is observed, though the variance again decreases with increasing relatedness:

So how is it that GREML estimates heritability from SNPs that the GRM never sees? In the generative model, relatedness induces a correlation between the typed and untyped SNPs for the related individuals, which then contaminate the SNP-heritability estimate. Intuitively, twins that share all of chromosome 1 also share all of chromosome 2 (both genetics and phenotype), so estimates from the former implicitly include effects from the latter. For unrelated individuals, chr1 is expected to be uncorrelated from chr2, yielding an estimate only of heritability from typed and correlated variants (i.e. SNP-heritability). Studies that include a mixture of related and unrelated individuals will yield a confounded estimate of “pseudo-heritability”, which is neither informative of total heritability (using only related samples) nor SNP-heritability. In this case, a bigger value is not necessarily better if it no longer has a clear interpretation for the trait. Computing accurate estimates of heritability therefore requires rigorously removing weakly related individuals, usually by pruning GRM values >0.05 or 0.025. While this is a heuristic, it ensures that the correlation between typed and untyped variants is no higher than 0.05^2 (in expectation) and mitigates the bias in practice.
Previous work. GREML and mixed models were introduced to human genetics as a means of controlling for relatedness. The seminal contribution of (Yang et al. 2010) was to establish the concept of SNP-heritability and demonstrating that, for unrelated individuals, this parameter was no longer a measure of confounding but inherently useful. Since then, computation of SNP-heritability has always come with the caveat that relatedness must be strictly controlled for. For a detailed treatment, see (Zaitlen et al. 2013) which quantified this phenomenon and leveraged a two component model to estimate both SNP- and total heritability simultaneously. As well as (Vattikuti, Guo, and Chow 2012) which restricted to related/unrelated individuals for accurate single-component estimates. More recently, a two component model for relatedness has also been used to improve risk prediction (Tucker et al. 2015).
The SKK findings are likely to be confounded by cryptic relatedness. All of this throat-clearing is meant to shed some light on what’s going on in the SKK analyses of real data. The paper estimates SNP-heritability of SBP at 0.263 (se 0.048). I believe this estimate is confounded by cryptic relatedness for the following reasons:
- SKK report using 2,698 “unrelated” individuals from the FHS. Previous work using the FHS reported 1,489 individuals at a relatedness cutoff of 0.025 (Vattikuti, Guo, and Chow 2012); and ~2,000 individuals at a relatedness cutoff of 0.05 (Wray et al. 2013). Assuming the same data are used, SKK are likely including a large number of individuals related at a level above 0.05.
- The estimate of 0.263 lies between the (Vattikuti, Guo, and Chow 2012) estimate for SBP of h2g=0.24 and h2=0.30. Though there is a lot of sampling error, this is consistent with simulations showing that cryptic relatedness biases the estimate of h2g towards the true h2.
- The standard error of 0.048 is much lower than expected for this sample size based on the GREML power calculator, lower even than the (Vattikuti, Guo, and Chow 2012) standard error of 0.05 from 5,647 individuals (standard error tracks roughly with sample size, so the FHS should be >2x higher). This is again consistent with the above simulations showing that cryptic relatedness decreases the estimate variance.
Since removing relatedness is a pre-requisite for estimating SNP-heritability, and since cryptic relatedness can confound all aspects of the heritability estimate, it is difficult to draw any conclusions from the SKK results in real data that generalize to studies of strictly unrelated individuals.
Other biases. Setting aside the confounding from relatedness, is it possible that the SKK results are still demonstrating real bias? In particular, Fig. 4 and Fig. 7 (reproduced below) show down-sampled estimates that are clearly not centered at the full-sample heritability:
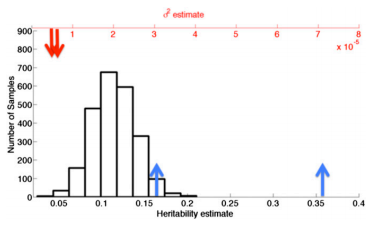
While the previous post demonstrated how differences in down-sampled variance are not indicative of bias, how to interpret this difference in down-sampled mean?
First, the decrease in the estimate of total heritability (difference from blue lines) is an expected consequence of down-sampling the SNPs. As SKK derive in eq. 3, the SNP-heritability estimates correspond to the total variance explained by all genotyped SNPs (); naturally, restricting the GRM to a random sub-sample of SNPs (thereby reducing P) will result in a lower estimate of heritability. Since this is a real trait, the extent and variance of the reduction will depend on the underlying genetic architecture and has nothing to do with the estimation procedure. This again underscores the important conceptual difference between SNP-heritability and total heritability (which is a parameter that does not depend on SNPs).
Second, the observation that the per-SNP heritability estimate is higher after down-sampling may be counter-intuitive, but is an expected consequence of LD between SNPs leading to more “effective” SNPs in the down-sampled data. Consider the case where the GRM is constructed from an increasing number of SNPs. A random sample of 5,000 SNPs is like drawing ~2 SNPs per megabase (on average), so there is very little LD between SNPs in the GRM and the effective number of independent SNPs, accounting for redundant tagging, is close to their total count. As more SNPs are included in the sample, they are more likely to be in LD with a SNP already present in the GRM, and their contribution to heritability previously tagged: the effective number of independent SNPs will grow slower than the total count of SNPs (this was separately observed by SKK in the section on saturation). In other words, in any genomic data with LD, down-sampled SNPs will tag more heritability per-SNP than full-sample SNPs, and will therefore have higher per-SNP heritability estimates. The reason this was not observed in the simulation is because it modeled the unique case of independent SNPs. Cryptic relatedness will further exacerbate this effect by inducing additional LD in the related individuals.
Whether you consider this a bias or not depends on the definition of the underlying parameter. Under the common definition of SNP-heritability as the variance explained by SNPs in the GRM and any SNPs in LD with them, the observations in Fig. 4, Fig. 7 (above), and general saturation are not an indicator of bias but of correlation between SNPs in the GRM.
Closing thoughts. I think the SKK paper makes a compelling case - in theory - that genetic stratification can create extremely large and unstable singular values in the GRM and lead to an overfit to the sample. However, I don’t believe that the empirical findings in real data adequately demonstrate that this bias is a serious concern in practice. Importantly, this bias needs to be demonstrated after stringently removing cryptic relatedness from the data, which will significantly reduce the distortion in singular values. Aside from cryptic relatedness, confounding of heritability estimates by subtle population structure - and whether principal components are an adequate solution in human populations - has been a hotly debated topic (Browning and Browning 2011; Goddard et al. 2011) and remains an open question, though no such confounding has yet been demonstrated.
References
- Krishna Kumar, Siddharth, Marcus W Feldman, David H Rehkopf, and Shripad Tuljapurkar. 2015. “Limitations Of GCTA as a Solution to the Missing Heritability Problem.” Proc Natl Acad Sci U S A, December. doi:10.1073/pnas.1520109113.
- Yang, Jian, Beben Benyamin, Brian P McEvoy, Scott Gordon, Anjali K Henders, Dale R Nyholt, Pamela A Madden, et al. 2010. “Common SNPs Explain a Large Proportion of the Heritability for Human Height.” Nat Genet 42 (7): 565–69. doi:10.1038/ng.608.
- Zaitlen, Noah, Peter Kraft, Nick Patterson, Bogdan Pasaniuc, Gaurav Bhatia, Samuela Pollack, and Alkes L Price. 2013. “Using Extended Genealogy to Estimate Components of Heritability for 23 Quantitative and Dichotomous Traits.” PLoS Genet 9 (5): e1003520. doi:10.1371/journal.pgen.1003520.
- Vattikuti, Shashaank, Juen Guo, and Carson C Chow. 2012. “Heritability And Genetic Correlations Explained by Common SNPs for Metabolic Syndrome Traits.” PLoS Genet 8 (3): e1002637. doi:10.1371/journal.pgen.1002637.
- Tucker, George, Po-Ru Loh, Iona M MacLeod, Ben J Hayes, Michael E Goddard, Bonnie Berger, and Alkes L Price. 2015. “Two-Variance-Component Model Improves Genetic Prediction In Family Datasets.” Am J Hum Genet 97 (5): 677–90. doi:10.1016/j.ajhg.2015.10.002.
- Wray, Naomi R, Jian Yang, Ben J Hayes, Alkes L Price, Michael E Goddard, and Peter M Visscher. 2013. “Pitfalls Of Predicting Complex Traits from SNPs.” Nat Rev Genet 14 (7): 507–15. doi:10.1038/nrg3457.
- Browning, Sharon R, and Brian L Browning. 2011. “Population Structure Can Inflate SNP-Based Heritability Estimates.” Am J Hum Genet 89 (1): 191–93; author reply 193–95. doi:10.1016/j.ajhg.2011.05.025.
- Goddard, Michael E., S. Hong Lee, Jian Yang, Naomi R. Wray, and Peter M. Visscher. 2011. “Response To Browning and Browning.” The American Journal Of Human Genetics 89 (1). Elsevier: 193–95. doi:10.1016/j.ajhg.2011.05.022.
Simulation details
The code for this simulation framework has been made available at https://github.com/sashagusev/SKK-REML-sim-related. It follows very closely with the simulation described in the previous post, please see documentation in that post for details. I have made trivial changes to compute the GRM from a subset of SNPs, and to introduce related individuals. The files are:
- func_reml.R : Functions implementing GREML with GCTA-like convergence criteria
- sim.R : Generates genotypes and the GRM. For computational speed I have reduced the sample size to 1,000 but kept the ratio of samples:SNPs constant to maintain the random matrix properties.
- run_rel.R : Replaces individuals with twins and computes heritability.
- plot.R : Generates figure with violin plots, assumes run_rel.out exists and is a concatenation of multiple outputs from run_rel.R
- run_rel_typed.R / plot_typed.R : Slight changes to the above scripts to remove any untyped SNPs, generating the second figure in this post.